Get Specialized with our Financial Planning & Analysis (FP&A) Program
Support business leaders in their decision-making with best-in-class financial models to evaluate and forecast the financial performance of a company.
How do you know if your business is on track or underperforming? When it comes to Financial Planning and Analysis (FP&A), the answer lies in the KPIs, or Key Performance Indicators. As an FP&A professional, you make decisions that move the business in the right direction using KPIs. Your success rests on the ability to connect KPIs to tangible business outcomes.
Beyond measurement, KPIs give you the ability to explain performance, identify opportunities for improvement, and suggest positive changes. This guide to KPIs in FP&A enables you to implement KPIs effectively and use them to support informed decision-making.

KPIs, or Key Performance Indicators, are metrics in FP&A that monitor progress toward specific financial goals over a specific period such as quarterly or annually. Think of KPIs as the pulse of an organization. They show whether the company is thriving or needs immediate intervention.
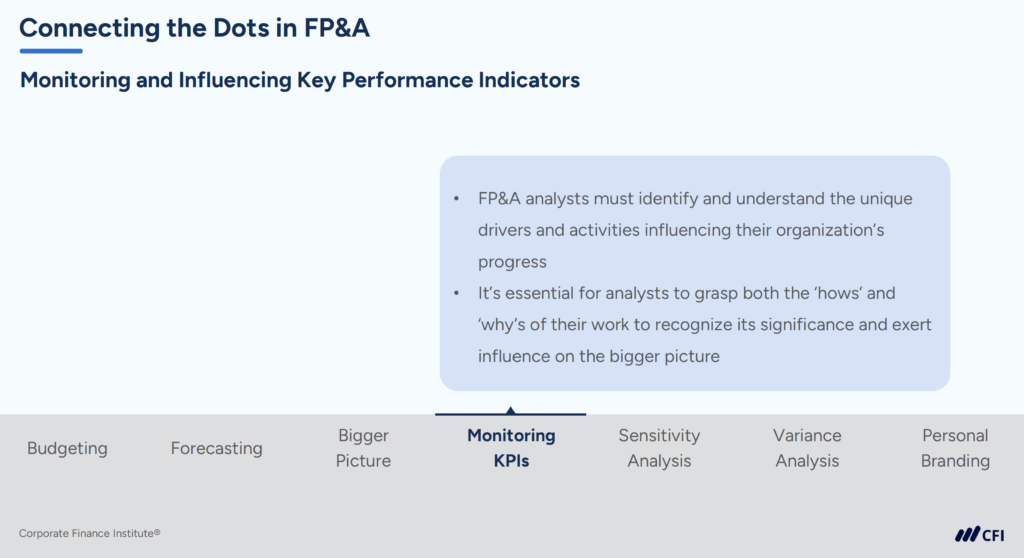
Unlike key business drivers — the factors that influence a company’s performance — KPIs provide quantifiable benchmarks. Combined, key business drivers and KPIs serve as a roadmap helping FP&A professionals identify trends, diagnose issues, and guide the business toward achieving its strategic objectives.
Imagine you’re an FP&A analyst at a rapidly growing retail company. Your manager asks you to monitor revenue growth and profitability. While these financial metrics are obvious KPIs, their real power lies in their connection to broader business drivers like customer satisfaction or operational efficiency.
For example, if revenue growth stagnates despite increased marketing spend, analyzing KPIs like customer conversion rates or customer acquisition costs (CAC) can reveal inefficiencies. KPIs give you the ability to isolate issues and provide actionable recommendations that directly impact profitability.
Not all KPIs are created equal. In FP&A, KPIs let professionals bridge the gap between raw financial data and actionable strategies. Effective KPIs connect operational drivers to financial outcomes, keeping teams working toward both short-term objectives and long-term goals.
For example, an FP&A analyst would use that insight to go deep into finding out, for instance, their company’s gross margin indicates inefficiencies in their production costs. The FP&A analyst further investigates and uses findings to recommend process improvements that realize efficiency gains.
Suppose another FP&A analyst tracks customer acquisition costs (CAC) against revenue to see whether the company’s marketing campaigns drove anticipated returns. If not, then the FP&A analyst can work with the marketing team to adjust budgets or campaigns.
The examples above illustrate how KPIs can transform data into actionable strategies. To truly understand what sets the best KPIs apart, it’s helpful to examine their defining characteristics.
This table outlines the key traits that make KPIs effective in FP&A.
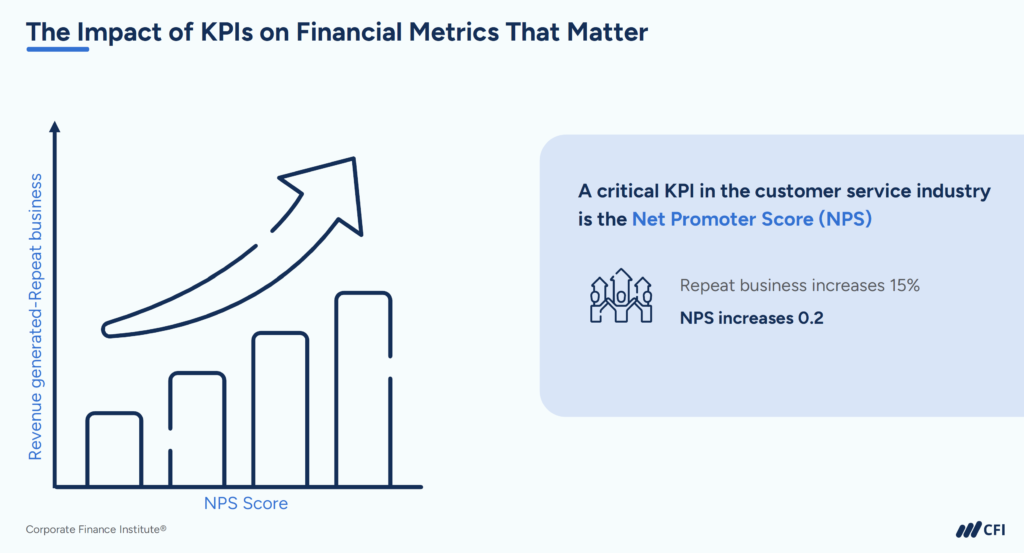
| ✅Relevance | Aligns with the company’s goals. | An e-commerce company focused on customer satisfaction might prioritize Net Promoter Score (NPS) to track loyalty and ensure alignment with its service-oriented goals. |
| ✅Measurability | Relies on quantifiable data. | Metrics like revenue growth or customer acquisition cost (CAC) provide concrete numbers that can be compared over time or against benchmarks. |
| ✅Actionability | Leads to insights that drive change. | Identifying a drop in gross margin can prompt cost reviews or process optimizations to restore profitability. |
| ✅Simplicity | Easy to understand and communicate. | A well-defined KPI like churn rate, which tracks how many customers leave a product or service over a set time, ensures stakeholders quickly grasp its importance and implications. |
By focusing on KPIs that reflect a company’s goals and measurable results, FP&A analysts can make sure their work is in line with business priorities and leads to clear improvements. This foundation thus sets the stage for identifying some of the most common KPIs used by FP&A teams in any business.
While the KPIs you use will depend on your organization and role, some universal metrics are indispensable in FP&A:
By tracking revenue growth, an FP&A analyst gains a clear view of revenue drivers and underperforming areas. Suppose an FP&A analyst at an e-commerce business identifies a region with consistently higher sales. Based on this insight, the analyst recommends reallocating marketing resources to help that region grow further.
Variance analysis helps identify gaps between budgeted and actual performance. Take a manufacturing company whose raw material costs exceed the budget. An FP&A analyst investigates and finds the company’s main supplier has raised prices. The analyst recommends an alternative sourcing strategy to better control raw material expenses.
Customer retention rate reveals how well a business keeps its customers over time. In a subscription-based service, like a streaming network, an FP&A analyst tracks retention trends to identify when customers are most likely to cancel. This insight can inform retention strategies like loyalty programs or product enhancements, directly impacting long-term revenue stability.
As an FP&A professional, your role goes way beyond just crunching numbers; rather, it’s about the use of KPIs in developing data and insights into actionable strategies that drive business performance improvement.
Simply said, KPIs keep businesses on track to achieve their financial goals. Here’s how you can use KPIs in your quest to make the biggest impact:
KPIs in FP&A function like a zoom lens, enabling analysts to examine specific departmental metrics or pan out for a comprehensive view of business health. This versatility allows FP&A professionals to inform both tactical adjustments and strategic decisions. By demonstrating your ability to connect KPIs to business strategy, you’ll build credibility that opens doors to roles in FP&A and beyond.
Ready to take the next step in your FP&A career journey? Master KPI-driven decision-making with CFI’s FP&A Specialization. Whether you’re new to FP&A or advancing your career, this program equips you to use KPIs, budgets, forecasts, and financial models to thrive in this in-demand role.
Earn Your FP&A Specialization!
Become an FP&A Manager: FP&A Skills and Responsibilities


